Introducing
Path Explore™ IOP and
IHC Explore™
Empowering cancer drug developers and clinical researchers with AI-powered insights
Learn more about the products and register for product demonstrations
PathExplore™ IOP and IHC Explore™ are for research use only. Not for use in diagnostic procedures.
Each product provides unprecedented single-cell and spatial resolution of the tumor microenvironment from routine pathology samples to facilitate biomarker discovery and deeper understanding of treatment response for the next generation of cancer therapeutics
PathExplore™ IOP (Immuno-Oncology Profiling) offers unparalleled visual and quantitative characterization of patterns of lymphocyte infiltration within the tumor and stroma. This innovation allows classification of immune phenotype based on diagnostic H&E images, facilitating deeper insights into immune response characteristics.
IHC Explore™ addresses the challenges of Immunohistochemistry (IHC) based scoring, providing AI-powered IHC assay quantification at tissue, cellular, and subcellular resolution. This tool enhances biomarker discovery and quantification, informing treatment strategies and patient stratification with unmatched precision.
PathExplore™ IOP
Immuno-Oncology Profiling
Enhance Immune-Oncology Profiling workflows with spatial characterization of tumor-infiltrating lymphocytes (TILs) in the tumor microenvironment (TME) directly from H&E
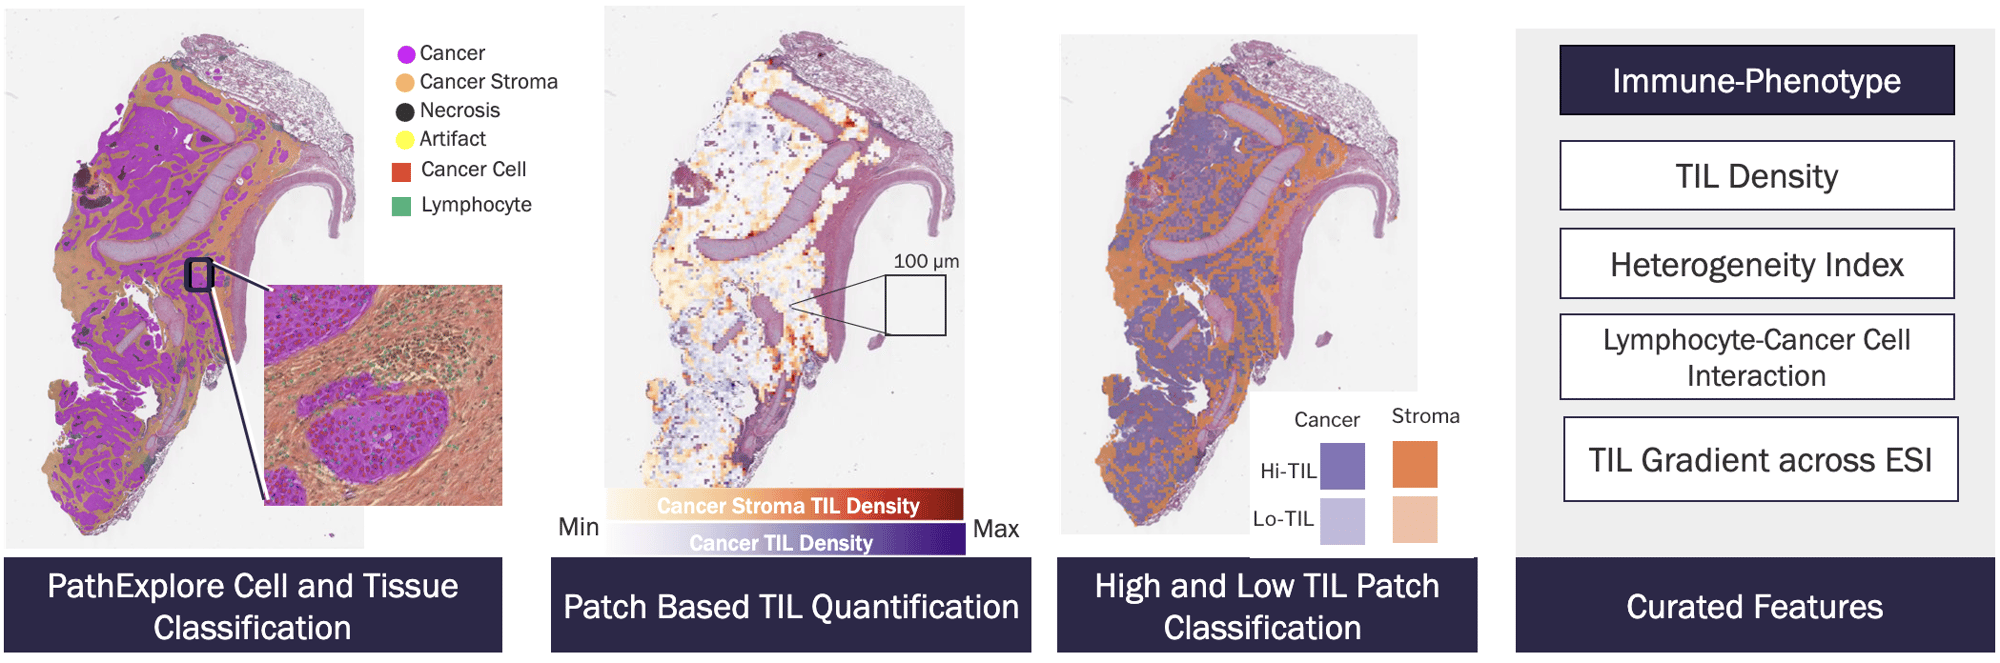
Identify, quantify, and classify TILs & immune phenotypes with high spatial resolution
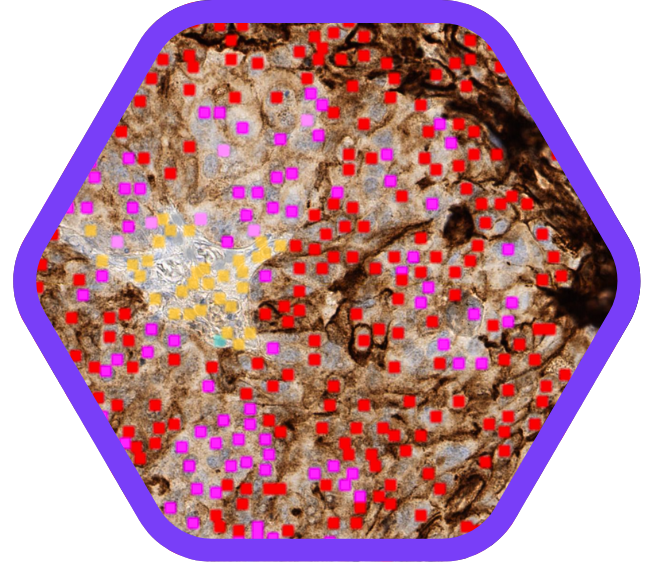
- Visualize the density & spatial distribution of TILs with single-cell resolution
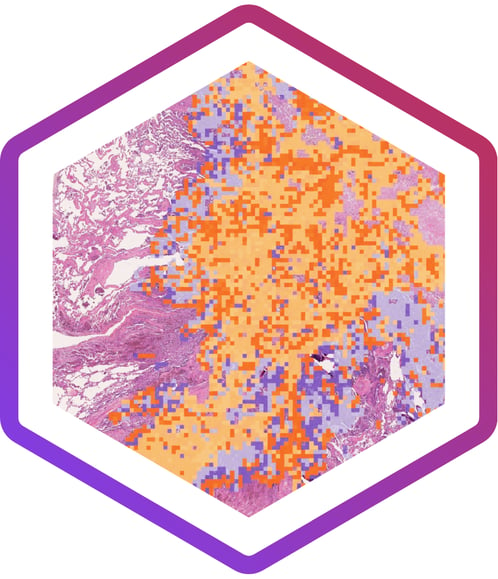
- Identify High and Low TIL density regions within tissue regions
- Analyze TIL populations and distributions by tissue compartments
- Quantify cell-cell interactions between tumor and immune cells
- Curated features designed to characterize the tumor-immune microenvironment
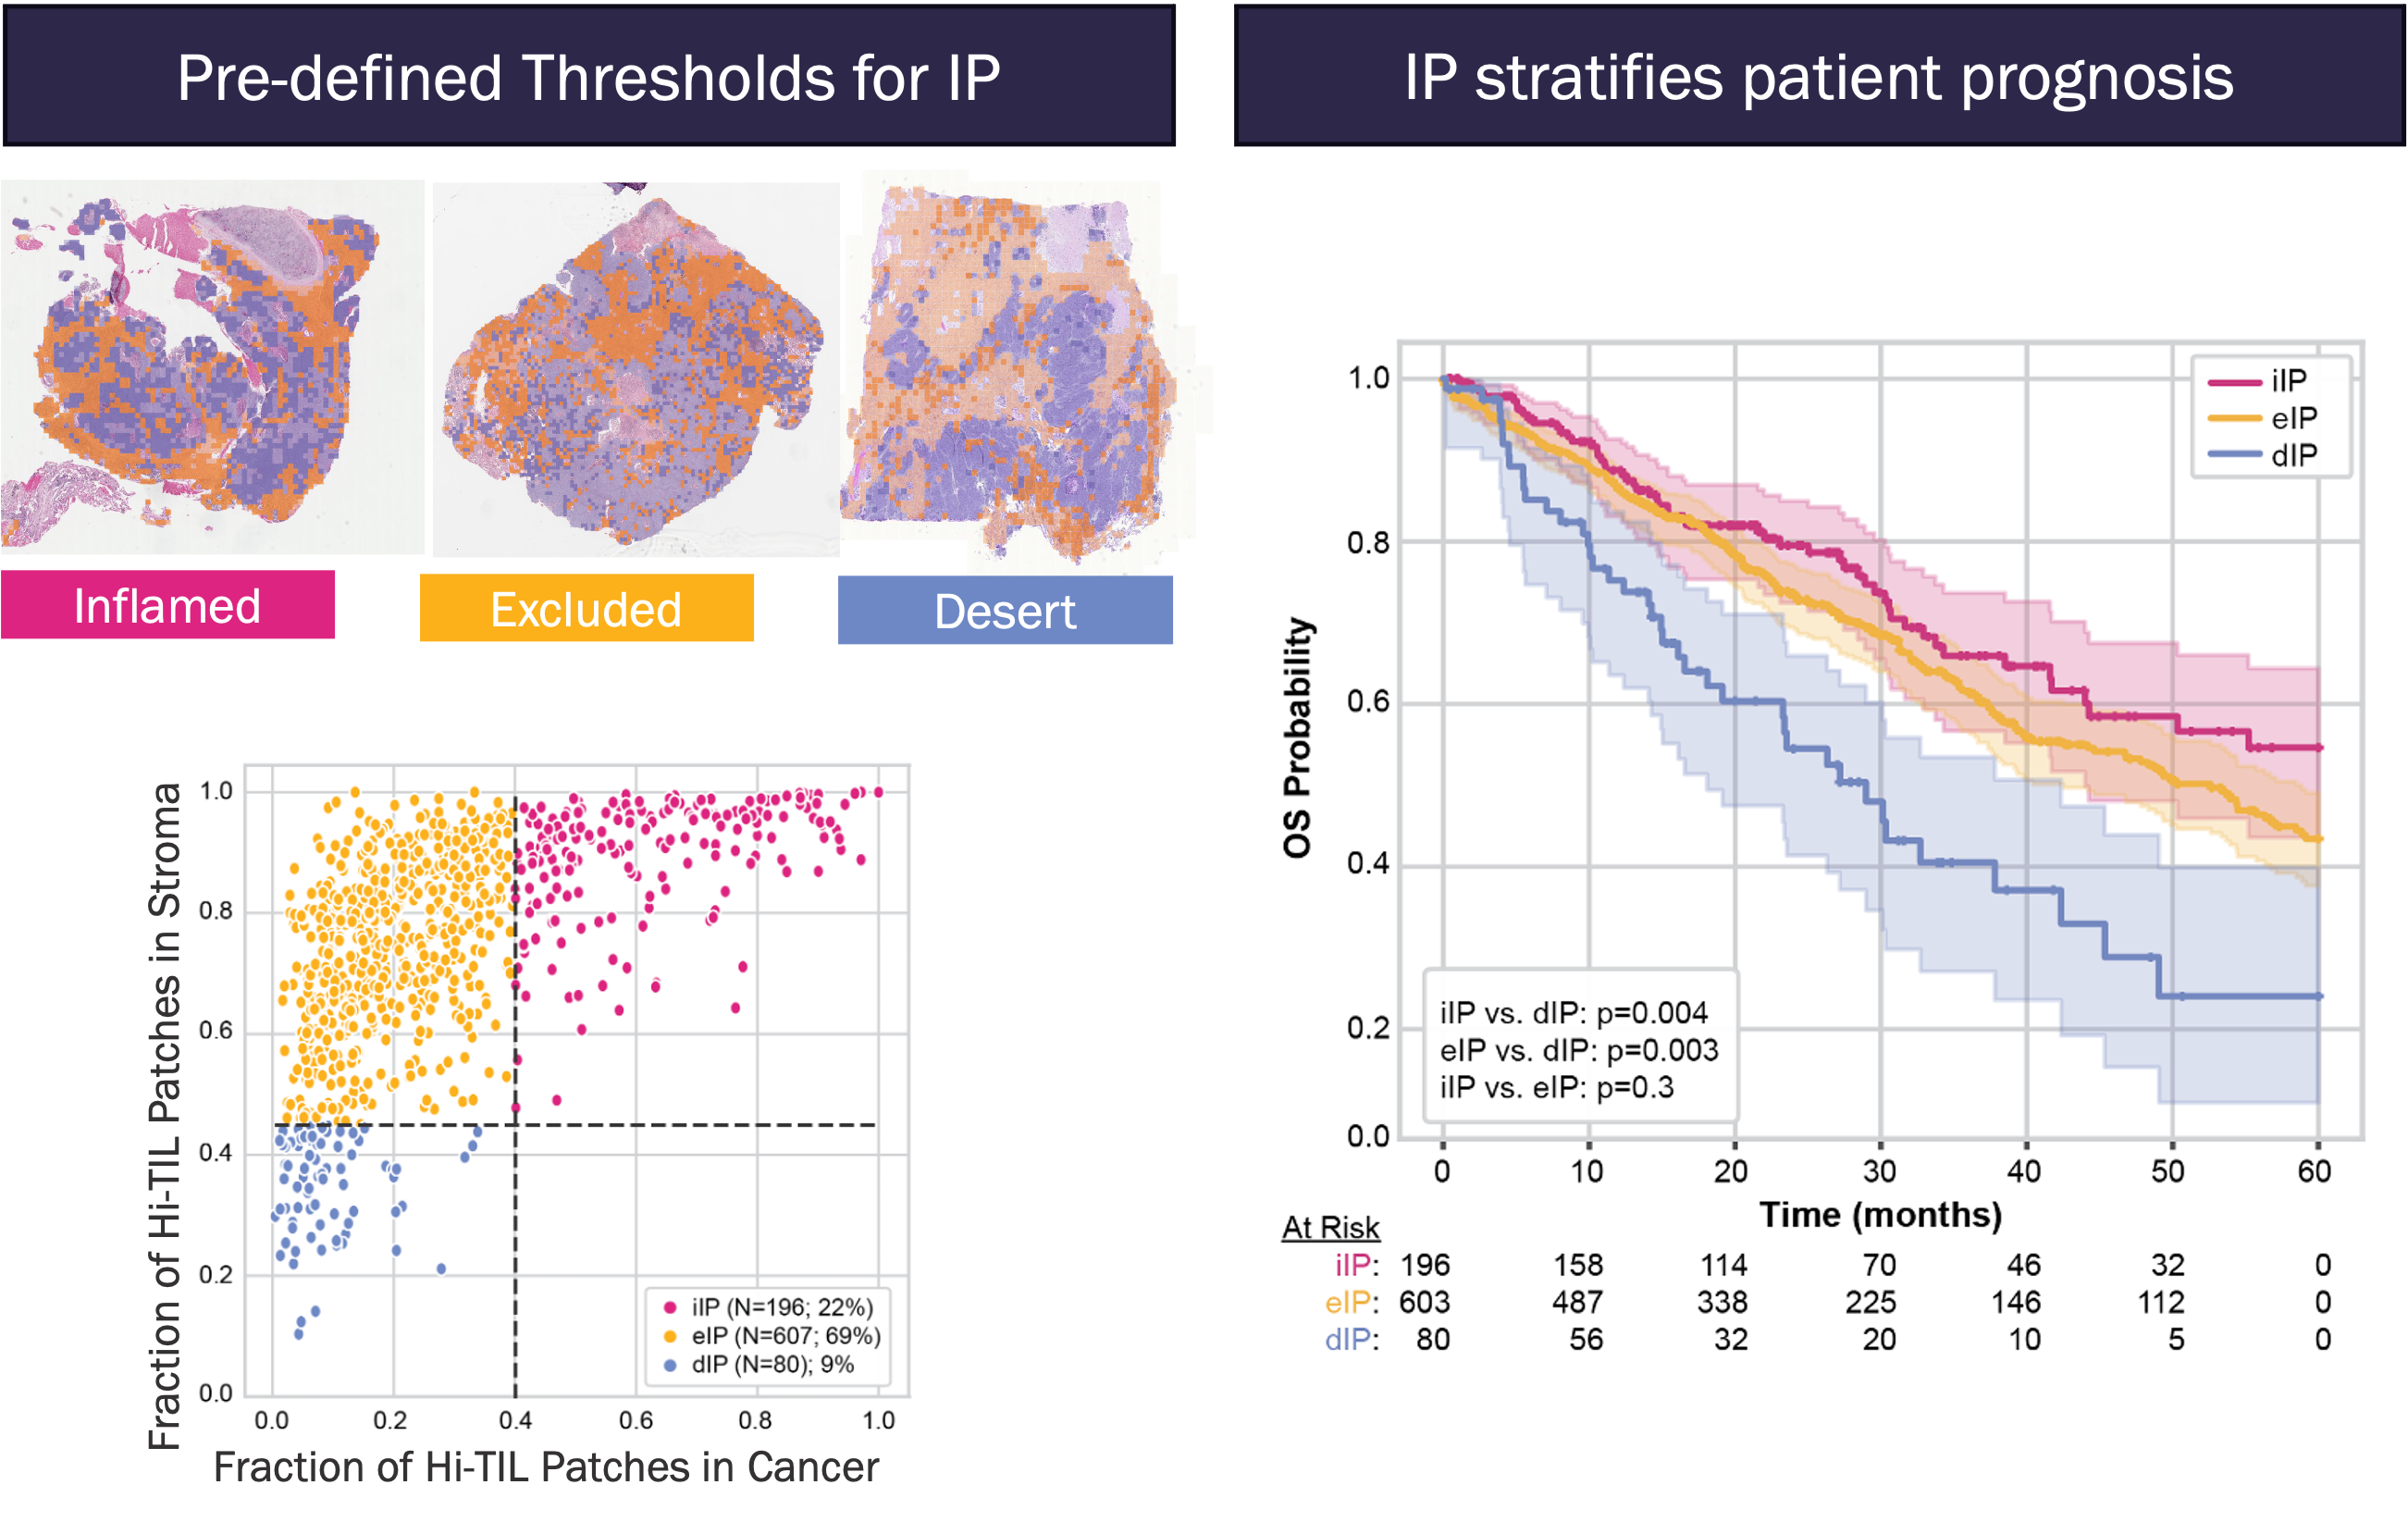
PathExplore™ IOP distinct immune profiles (IP) stratifies patient prognosis and treatment response
- Measure % of “High TIL” and “Low TIL” micro patches in each tissue area enables accurate classification of immune phenotypes taking into account heterogeneity of distribution
- Quantitative analytics is used to identify generalizable thresholds for assigning slide-level-based IPs
- Investigations indicate promising applications of IP for patient stratification and novel biomarker discovery
IHC Explore™
AI-Powered Biomarker Quantification
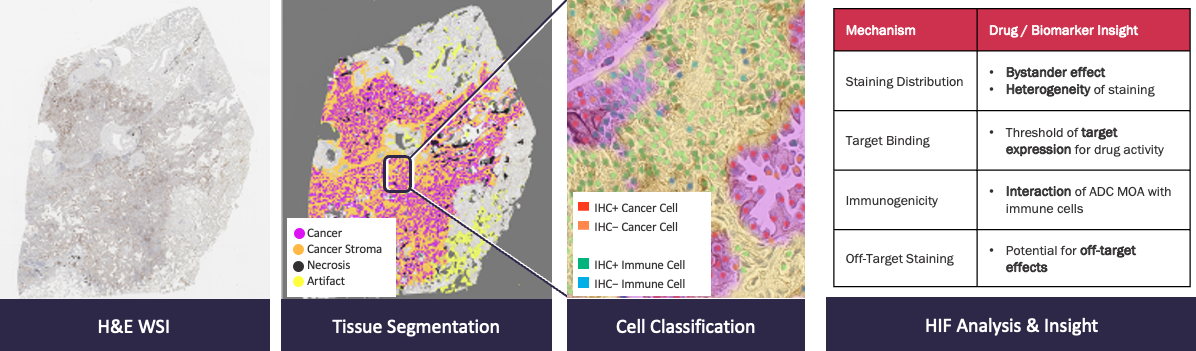
Extract key histopathological features from Immunohistochemistry (IHC) slide images & transform IHC whole-slide images into quantitative insights for next-generation biomarker development
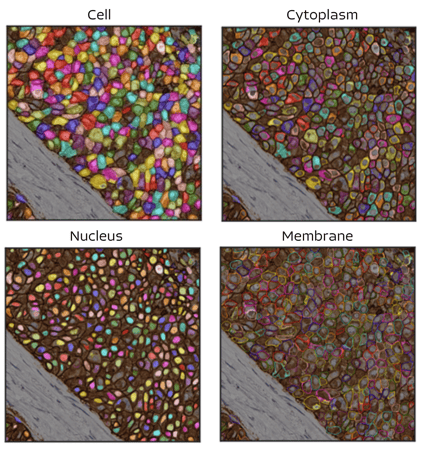
Characterize IHC stains and biomarker expression with spatially-contextualized, single-cell resolution
- Accelerate and enhance the development of AI-enabled biomarkers for novel IHC assays
- Rapid deployment at scale enables continuous quantification of biomarkers
- Deep quantitative measurements of cell types, stain intensity, and completeness
- Identify spatial patterns of stain and expression heterogeneity that are not encapsulated by categorical scores
- Unveil distinct sub-populations that drive novel biomarker discovery and standardization for scoring strategies
CASE STUDY
AI-Assisted Titer Selection in Early Assay Development
- PathAI deployed IHC Explore on prostate cancer specimens stained with a novel, in-development assay
- IHC Explore quantifies staining intensity at single-cell resolution, enabling rapid assay characterization and titer optimization
- Continuous staining intensity measurement provides added value for next-generation biomarkers and precision medicine strategies